


Income Inequality News Articles
Below are key excerpts of revealing news articles on income inequality from reliable news media sources. If any link fails to function, a paywall blocks full access, or the article is no longer available, try these digital tools.

Some of the world's biggest, most profitable corporations enjoy a far lower tax rate than you do – that is, if they pay taxes at all. The most egregious example is General Electric. Last year the conglomerate generated $10.3 billion in pretax income, but ended up owing nothing to Uncle Sam. In fact, it recorded a tax benefit of $1.1 billion. How did this happen? It's complicated. GE in effect consists of two divisions: General Electric Capital and everything else. The everything else – maker of engines, power plants, TV shows and the like – would have paid a 22% tax rate if it was a standalone company. It's GE Capital that keeps the overall tax bill so low. Over the last two years, GE Capital has displayed an uncanny ability to lose lots of money in the U.S. (posting a $6.5 billion loss in 2009), and make lots of money overseas (a $4.3 billion gain). Not only do the U.S. losses balance out the overseas gains, but GE can defer taxes on that overseas income indefinitely. It's the tax benefit of overseas operations that is the biggest reason why multinationals end up with lower tax rates than the rest of us.
Note: Forbes later changed the title of this article to a more innocuous "What The Top U.S. Companies Pay In Taxes." Can you believe that GE not only pays no taxes, they actually get credit from the US government? They ship US jobs overseas and then reap huge tax benefits as a result. What's wrong with this picture? For a wealth of media news articles on the hidden manipulations of major financial corporations, click here.
Half of all the money contributed so far to Democratic and Republican presidential candidates - $176 million - has come from just 158 families, along with the companies they own or control. Who are these people? According to the report, most of these big contributors live in exclusive neighborhoods where they have private security guards instead of public police officers, private health facilities rather than public parks and pools. Most send their kids and grand kids to elite private schools rather than public schools. They fly in private jets and get driven in private limousines rather than rely on public transportation. They don't have to worry about whether Social Security or Medicare will be there for them in their retirement because they've put away huge fortunes. It's doubtful that most of these 158 are contributing to these campaigns out of the goodness of their hearts. They're largely making investments, just the way they make other investments. And the success of these investments depends on whether their candidates get elected, and will lower their taxes even further, expand tax loopholes, shred health and safety and environmental regulations so their companies can make even more money, and cut Social Security and Medicare and programs for the poor - and thereby allow these 158 and others like them to secede even more from the rest of our society. These people are, after all, are living in their own separate society. They want to elect people who will represent them, not the rest of us.
Note: As the Democrats and Republicans duke it out, the ultra-rich laugh all the way to the bank. What if instead of fighting each other, we worked together to expose the manipulations of the ultra-rich? This essay was written by former US Secretary of Labor Robert Reich. For more along these lines, see concise summaries of deeply revealing income inequality news articles from reliable major media sources.
The pandemic has made the rich richer while the income of the rest of the world – about 99% of humanity – dropped, according to a new Oxfam report titled "Inequality Kills." The wealth of the world's 10 richest men doubled from $700 billion to $1.5 trillion during the pandemic, the global charity said on Monday. "It has never been so important to start righting the violent wrongs of this obscene inequality by clawing back elites' power and extreme wealth including through taxation – getting that money back into the real economy and to save lives," said Oxfam International's Executive Director Gabriela Bucher. A 99% windfall tax on the pandemic gains of the world's 10 richest men would raise enough money to pay for vaccines for the world – as well as finance various social measures for more than 80 countries, the report said. The wealth of billionaires rose more since Covid started compared to the last 14 years, and a new billionaire was minted every 26 hours since the pandemic began. The CEOs of Covid vaccine-developers Moderna and BioNTech made billions in 2020 as a result of the pandemic. At the same time, the vast majority of the population are worse off after losing income during Covid-19, and 160 million more people fell into poverty. One way to "claw back" the huge gains made by billionaires during the crisis is to tax the money that billionaires have made since the start of the pandemic. Even after the tax, the world's 10 richest men would still be billionaires.
Note: For more along these lines, see concise summaries of deeply revealing news articles on the coronavirus and income inequality from reliable major media sources.
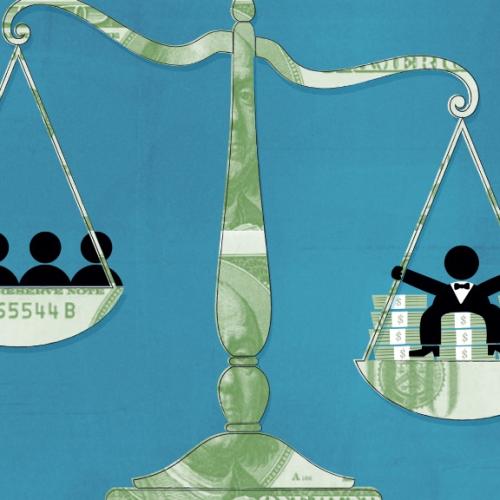
It's a perfect storm. I'm talking about the dangers facing our democracy. First, income in America is now more concentrated in fewer hands than it has been in 80 years. Almost a quarter of total income generated in the United States is going to the top 1 percent of Americans. The top one-tenth of 1 percent of Americans now earn as much as the bottom 120 million of us. Who are these people? They're top executives of big corporations and Wall Street, hedge-fund managers and private equity managers. Hundreds of millions of dollars are pouring into advertisements for and against candidates - without a trace of where the dollars are coming from. They're laundered through a handful of groups. Most Americans are in trouble. Their jobs, incomes, savings and even homes are on the line. They need a government that's working for them, not for the privileged and the powerful. Yet their state and local taxes are rising. And their services are being cut. There's no jobs bill to speak of. Washington says nothing can be done. There's no money left. No money? The marginal income tax rate on the very rich is the lowest it has been in more than 80 years. Under President Dwight Eisenhower ... it was 91 percent. Now it's 36 percent. We're losing our democracy to a different system. It's called plutocracy.
Note: As the Democrats and Republicans duke it out, the ultra-rich laugh all the way to the bank. What if instead of fighting each other, we worked together to expose the manipulations of the ultra-rich? Whether you are on the left or right of the political spectrum, this incisive article by former US Sect. of Labor Robert Reich is well worth reading in its entirety. For more in income inequality, click here.
The pandemic has made the world's wealthiest far richer but has led to more people living in poverty, according to the charity Oxfam. Lower incomes for the world's poorest contributed to the death of 21,000 people each day. But the world's 10 richest men have more than doubled their collective fortunes since March 2020, Oxfam said. Oxfam typically releases a report on global inequality at the start of the World Economic Forum meeting in Davos. That event usually sees thousands of corporate and political leaders, celebrities, campaigners, economists and journalists gather in the Swiss ski resort for panel discussions, drinks parties and schmoozing. However for the second year running, the meeting (scheduled for this week) will be online-only after the emergence of the Omicron variant derailed plans to return to an in-person event. Danny Sriskandarajah, Oxfam GB's chief executive, said the charity timed the report each year to coincide with Davos to attract the attention of economic, business and political elites. "This year, what's happening is off the scale," he said. "There's been a new billionaire created almost every day during this pandemic, meanwhile 99% of the world's population are worse off because of lockdowns, lower international trade, less international tourism, and as a result of that, 160 million more people have been pushed into poverty." "Something is deeply flawed with our economic system," he added.
Note: BBC sadly fails to mention it is not the pandemic that has caused all of this, but the lockdowns. 21,000 a day, which is one million every 50 days, died as a result of the lockdowns. 160 million humans fell into poverty a result of these lockdowns, not to mention the huge increase in suicides, murders, domestic abuse, shuttered small businesses, and more. Even if a million lives were saved by the lockdowns, was it worth these tremendous costs? For more, see summaries of deeply revealing news articles on the coronavirus from reliable media sources.
The elephant in the room is extreme income inequality. How big is this elephant? A staggering $50 trillion. That is how much the upward redistribution of income has cost American workers over the past several decades ... according to a groundbreaking new working paper by Carter C. Price and Kathryn Edwards of the RAND Corporation. Had the more equitable income distributions of the three decades following World War II (1945 through 1974) merely held steady, the aggregate annual income of Americans earning below the 90th percentile would have been $2.5 trillion higher in the year 2018 alone. That is an amount equal to nearly 12 percent of GDP - enough to more than double median income - enough to pay every single working American in the bottom nine deciles an additional $1,144 a month. Price and Edwards calculate that the cumulative tab for our four-decade-long experiment in radical inequality had grown to over $47 trillion from 1975 through 2018. As a result, the top 1 percents share of total taxable income has more than doubled, from 9 percent in 1975, to 22 percent in 2018, while the bottom 90 percent have seen their income share fall, from 67 percent to 50 percent. This represents a direct transfer of income ... from the vast majority of working Americans to a handful at the very top. A 2014 report from the OECD estimated that rising income inequality knocked as much 9 points off U.S. GDP growth over the previous two decades.
Note: For more along these lines, see concise summaries of deeply revealing news articles on income inequality from reliable major media sources.
Since the Reagan administration, Republicans have fervently claimed lower taxes will unleash the "makers" incentivizing them to work harder and invest more, thereby trickling down to benefit ordinary Americans. Moreover, they have consistently claimed that their tax cuts would create such dramatic economic growth that theyd literally pay for themselves. Instead, the national debt is at a record high, and the gap between the richest and the poorest U.S. households is now the largest it has been in the 52 years the Census Bureau has been tracking it. And that inequality gap started to expand dramatically about the same time the Republican Party started cutting taxes. The American economy since 1950 offers a chance to consider the impact of these tax cuts. From 1950 to 1980, the top federal marginal tax rates ... were as high as 92% and never below 70%. Republicans have been slashing the top tax bracket for annual earned income since the early 1980s, and it is now 37%. Further, in 2003 the GOP shrank the tax rate on unearned income (such as dividends) to 15%, resulting (for example) in the billionaire Warren Buffett having a lower tax rate than his secretary. With such dramatic tax cuts, GOP dogma predicted a booming U.S. economy. But it turns out U.S. economic growth was substantially higher during the period of high taxes. From 1950 to 1980, average annual growth in real (inflation-adjusted gross domestic product) was 3.9%, while from 1981 to 2018 the comparable number was 2.7%.
Note: For more along these lines, see concise summaries of deeply revealing news articles on government corruption and income inequality from reliable major media sources.
A COVID-19 envoy appointed by Director-General of the World Health Organisation (WHO) Dr Tedros Adhanom Ghebreyesus has appealed to world leaders to stop resorting to lockdown to control the pandemic. Dr David Nabarro, who has spent his career working for the WHO and the United Nations (UN), seems to have marked a departure from the global health body's early stance on the COVID-19 pandemic, warning about the economic and social consequences of lockdown as a means of controlling the spread of the disease. On Sunday, Dr Nabarro appealed to world leaders to stop "using lockdowns as your primary control method", insisting that such drastic measures can have a dire impact on global poverty rates. The British doctor stated: "We in the World Health Organisation do not advocate lockdowns as the primary means of control of this virus. The only time we believe a lockdown is justified is to buy you time to reorganise, regroup, rebalance your resources, protect your health workers who are exhausted, but by and large, we'd rather not do it." Dr Nabarro went on to say that developing economies had been indirectly affected by lockdown measures, adding: "Look what's happened to smallholder farmers all over the world -- look what's happening to poverty levels. "It seems that we may well have a doubling of world poverty by next year. We may well have at least a doubling of child malnutrition. Lockdowns just have one consequence that you must never ever belittle, and that is making poor people an awful lot poorer."
Note: Strangely, this article has been removed from the MSN website. Even the copy at archive.org shows for a minute and then disappears. The full, revealing article can still be found on this webpage. For more along these lines, see concise summaries of deeply revealing news articles on the coronavirus and income inequality from reliable major media sources.
All around the world, the coronavirus and its restrictions are pushing already hungry communities over the edge, cutting off meager farms from markets and isolating villages from food and medical aid. Virus-linked hunger is leading to the deaths of 10,000 more children a month over the first year of the pandemic, according to an urgent call to action from the United Nations shared with The Associated Press ahead of its publication in the Lancet medical journal. Further, more than 550,000 additional children each month are being struck by what is called wasting, according to the U.N. – malnutrition that manifests in spindly limbs and distended bellies. Over a year, that's up 6.7 million from last year's total of 47 million. Wasting and stunting can permanently damage children physically and mentally, transforming individual tragedies into a generational catastrophe. From Latin America to South Asia to sub-Saharan Africa, more families than ever are staring down a future without enough food. The analysis published Monday found about 128,000 more young children will die over the first 12 months of the virus. In April, World Food Program head David Beasley warned that the coronavirus economy would cause global famines "of biblical proportions" this year.
Note: Meanwhile, as the Washington Post reported on Jan. 1, 2021, "billionaires as a class have added about $1 trillion to their total net worth since the pandemic began." For more along these lines, see concise summaries of deeply revealing news articles on the coronavirus and income inequality from reliable major media sources.
The coronavirus pandemic and corresponding lockdown made way for "one of the greatest wealth transfers in history," CNBC's Jim Cramer said. The stock market is rising as big business rebounds from state-ordered stoppage of nonessential activity, while small businesses drop like flies. Despite the ongoing economic woes, the S&P index of 500 large-cap companies, which is considered a benchmark for the stock market, is within striking distance of its levels from the start of the trading year. Since bottoming near 2,191 in March, the index is up about 42%. The tech-heavy Nasdaq 100 has recovered all of its losses from the coronavirus meltdown and set a new high. Many investors are betting on a V-shaped economic recovery, Cramer said. "I think we're looking at a V-shaped recovery in the stock market, and that has almost nothing to do with a V-shaped recovery in the economy," he said. Chapter 11 bankruptcies in May ballooned by 48% compared to a year ago. "That's that pesky real world asserting itself, but the only big bankruptcy we've seen in the stock market is Hertz," Cramer said. Cramer said it still only scratches the surface of what impact the halt in global economic activity will have on the country.
Note: This report is from June 2020, early in the pandemic. How many more bankruptcies occurred after that? This astoundingly blunt 10-minute interview from 2006 by the Street's James Altucher of CNBC's Jim Cramer telling his secrets is amazingly revealing. A Harvard-educated former hedge fund manager, Cramer shows just how depraved and heartless some stock market trading is and how corrupt hedge funds traders are in particular. For more, see concise summaries of deeply revealing news articles on the coronavirus from reliable major media sources.
The most important economic and political issues facing this country are the extraordinary levels of income and wealth inequality, the rapidly growing concentration of ownership, the long-term decline of the American middle class and the evolution of this country into oligarchy. We know how important these issues are because our ruling class works overtime to prevent them from being seriously discussed. We now have more income and wealth inequality than at any time in the last hundred years. Wages ... are lower today than they were almost 50 years ago. When I was a kid growing up, most families were able to be supported by one breadwinner. Now an overwhelming majority of households need two paychecks to survive. Since 1975, there has been a massive redistribution of wealth in America that has gone in exactly the wrong direction. Over the past 47 years, according to the Rand Corporation, $50tn in wealth has been redistributed from the bottom 90% of American society to the top 1%, primarily because a growing percentage of corporate profits has been flowing into the stock portfolios of the wealthy and the powerful. During this terrible pandemic ... some 700 billionaires in America became nearly $2tn richer. Just three Wall Street firms (Blackrock, Vanguard and State Street) control assets of over $20tn and are the major stockholders in 96% of S&P 500 companies. In terms of media, some eight multinational media conglomerates control what we see, hear and read.
Note: The above was written by Sen. Bernie Sanders. For more along these lines, see concise summaries of deeply revealing news articles on income inequality from reliable major media sources.
At the end of 2020, Chicago police reported more than 750 murders, a jump of more than 50% compared with 2019. By mid-December, Los Angeles saw a 30% increase over the previous year with 322 homicides. There were 437 homicides in New York City by Dec. 20, nearly 40% more than the previous year. New Orleans-based data consultant Jeff Asher studied crime rates in more than 50 cities and says the crime spikes aren't just happening in big cities. With the numbers of homicides spiking in many places, Asher expects the final statistics for 2020 to tell a startlingly grim story. "We're going to see, historically, the largest one-year rise in murder that we've ever seen," he says. Asher says it has been more than a half-century since the country saw a year-to-year murder rate that jumped nearly 13%. "We have good data that the rise in murder picked up in the early stages of the summer," Asher says, "and we also have good data that the rise of murder picked up again in September and October as some of the financial assistance started to wear off." Chicago minister the Rev. Marshall Hatch Sr. says the spike in violence is sadly not surprising. His church is located in a west side Chicago neighborhood hard hit by both poverty and the pandemic. "COVID has had a disproportionate impact and people are increasingly desperate," Hatch says. "And people, because of the concentration of poverty, tend to turn on each other."
Note: It is not the pandemic which is causing these homicides. It is the lockdown measures that are negatively impacting the emotional and spiritual lives of billions of people around the globe. The CDC also reports overdose deaths hit a record high last year. And poverty had the sharpest rise in 50 years. For more along these lines, see concise summaries of deeply revealing news articles on the coronavirus and income inequality from reliable major media sources.
Income inequality has given the rich a greater share of the economic spoils than middle- and low-income earners. That's resulted in a very real impact on the incomes of middle- and low-income households, with the typical full-time American worker now earning $42,000 less than they would have if inequality hadn't surged over the last four decades. That's according to a new analysis from researchers at Rand, the global policy think tank. Its researchers wanted to look at the dollars-and-cents impact on U.S. households from yawning income inequality. Prior to the mid-1970s, Americans' incomes, no matter their level, generally rose in step with overall economic growth. That changed in the late 1970s, with the rich capturing the lion's share of economic growth, while middle-class and lower-income workers eked out gains far below par. In 2018, the typical full-time worker earned about $50,000 but if that same worker had kept up with the economy's expansion, they would have earned $92,000 annually, the Rand analysis found. Only the top 5% of Americans have enjoyed earnings that approached or exceeded the nation's economic growth. Meanwhile, the top 1% has come out far ahead, gaining a far greater share of economic growth than they did prior to the 1970s. The typical person in the top 1% earned $1.4 million in 2018, but would have earned $630,000 less than half that amount were it not for benefitting from widening inequality, the analysis found.
Note: For more along these lines, see concise summaries of deeply revealing news articles on income inequality from reliable major media sources.
Emmanuel Saez and Gabriel Zucman say were coddling a tiny minority of ultra-rich Americans, and theyd like to put a stop to it. The Triumph of Injustice demonstrates how small sets of wealthy, white, well-connected citizens command inordinate financial and political clout. This, it seems, is the season for such books. Investigative reporter Aaron Glantzs Homewreckers focuses on billionaires who cash in when the middle class struggles. Anne Nelsons Shadow Network is about a coterie of influential far-right operatives. Taken together, these smart, engrossing titles paint a stark picture of the power wielded by a handful of plutocrats and religious hard-liners. Theres always been economic inequality, but its worse today than just decades ago. According to Saez and Zucman, Americas richest 1% own 37% of the nations wealth (housing, pension funds, and all financial assets), up from 22% at the end of the 1970s. Conversely, the wealth share of the bottom 90% of adults has declined from 40% to 27%. Counting all forms of taxation, Saez and Zucman say that the great majority of Americans pay 25% to 30% of their income in taxes into the public coffers. By contrast, Americas 400 richest people barely pay 20%. This disparity is the result of many factors. These include ... access to offshore bank accounts, exotic trusts (and) hidden shell corporations, Saez and Zucman write. Corporations use similar tactics. Facebook, for one, has dodged billions in corporate taxes by establishing a presence in the Cayman Islands.
Note: For more along these lines, see concise summaries of deeply revealing news articles on income inequality from reliable major media sources.
The gap between the super rich and the rest of the world widened last year as wealth continued to be owned by a small minority, Oxfam has claimed. Some 82% of money generated last year went to the richest 1% of the global population while the poorest half saw no increase at all, the charity said. It blamed tax evasion, firms' influence on policy, erosion of workers' rights, and cost cutting for the widening gap. Oxfam has produced similar reports for the past five years. In 2017 it calculated that the world's eight richest individuals had as much wealth as the poorest half of the world. This year, it said 42 people now had as much wealth as the poorest half, but it revised last year's figure to 61. Oxfam said the revision was due to improved data and said the trend of "widening inequality" remained. Oxfam's report coincides with the start of the World Economic Forum in Davos, a Swiss ski resort. The annual conference attracts many of the world's top political and business leaders. The charity is urging a rethink of business models, arguing their focus on maximising shareholder returns over broader social impact is wrong. It said there was "huge support" for action with two thirds (72%) of 70,000 people it surveyed in ten countries saying they wanted their governments to "urgently address the income gap between rich and poor". Oxfam's report is based on data from Forbes and the annual Credit Suisse Global Wealth databook, which gives the distribution of global wealth going back to 2000.
Note: For more along these lines, see concise summaries of deeply revealing income inequality news articles from reliable major media sources.
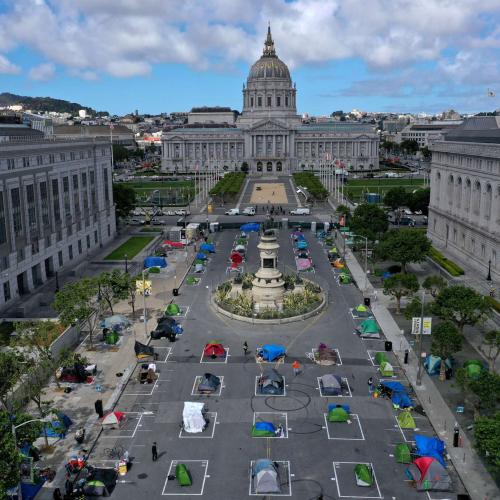
Ray, a man in his 50s, used to live in an emergency homeless shelter in Vancouver, Canada. Then he participated in a study that changed his life. The newly published, peer reviewed PNAS study, conducted by the charity Foundations for Social Change in partnership with the University of British Columbia, was fairly simple. It identified 50 people in the Vancouver area who had become homeless in the past two years. In spring 2018, it gave them each one lump sum of $7,500 (in Canadian dollars). And it told them to do whatever they wanted with the cash. Over the next year, the study followed up with the recipients periodically, asking how they were spending the money and what was happening in their lives. The recipients of the cash transfers did not increase spending on drugs, tobacco, and alcohol, but did increase spending on food, clothes, and rent. What’s more, they moved into stable housing faster and saved enough money to maintain financial security over the year of follow-up. “Counter to really harmful stereotypes, we saw that people made wise financial choices,” Claire Williams, the CEO of Foundations for Social Change, [said]. What’s more ... giving out the cash transfers in the Vancouver area actually saved the broader society money. Enabling 50 people to move into housing faster saved the shelter system $8,277 per person over the year, for a total savings of $413,850. That’s more than the value of the cash transfers, which means the transfers pay for themselves.
Note: Explore more positive stories like this in our comprehensive inspiring news articles archive focused on solutions and bridging divides.
The end of 2020 brought the sharpest rise in the U.S. poverty rate since the 1960s, according to a new study. Economists Bruce Meyer from the University of Chicago and James Sullivan of the University of Notre Dame found that the poverty rate increased by 2.4 percentage points during the latter half of 2020 as the U.S. continued to suffer the economic impacts of COVID-19. That percentage-point rise is nearly double the largest annual increase in poverty since the 1960s. This means an additional 8 million people nationwide are now considered poor. Moreover, the poverty rate for Black Americans is estimated to have jumped by 5.4 percentage points, or by 2.4 million individuals. The scholars’ findings, released Monday, put the rate at 11.8% in December. While poverty is down from readings of more than 15% a decade earlier, the new estimates suggest that the annual Census Bureau tally due in September will be higher than the last official, pre-pandemic level of 10.5% in 2019. Black Americans were more than twice as likely to be poor than their white counterparts in December — an improvement from the summer months when they were nearly three times more apt to live in poverty — but an increase from before the pandemic, when the differential was under two. Despite improvements in the overall poverty rate since the middle of the 20th century, Black Americans had been about three times as likely to be poor as white Americans for most of the past 60 years.
Note: Meanwhile, as the Washington Post reported on Jan. 1, 2021, "billionaires as a class have added about $1 trillion to their total net worth since the pandemic began." The CDC also reports overdose deaths hit a record high last year. For more along these lines, see concise summaries of deeply revealing news articles on the coronavirus and income inequality from reliable major media sources.
The pandemic has forced untold hardships onto many Americans, with tens of millions of families now reporting that they don’t have enough to eat and millions more out of work on account of layoffs and lockdowns. America’s wealthiest, on the other hand, had a very different kind of year: Billionaires as a class have added about $1 trillion to their total net worth since the pandemic began. And roughly one-fifth of that haul flowed into the pockets of just two men: Jeff Bezos, chief executive of Amazon (and owner of The Washington Post), and Elon Musk of Tesla and SpaceX fame. Musk has quintupled his net worth since January, according to estimates put together by Bloomberg, adding $132 billion to his wealth and vaulting him to the No. 2 spot among the world’s richest with a fortune of about $159 billion. Bezos’s wealth has grown by roughly $70 billion over the same period, putting his net worth estimate at roughly $186 billion as the year came to an end. Such a rapid accumulation of individual wealth hasn’t happened in the United States since the time of the Rockefellers and Carnegies a century ago, and we as a society are only just beginning to grapple with the ethical implications. What does it mean, for instance, that two men amassed enough wealth this year to end all hunger in America (with a price tag of $25 billion) eight times over? Or that the $200 billion accumulated by Bezos and Musk is greater than the amount of coronavirus relief allocated to state and local governments in the Cares Act?
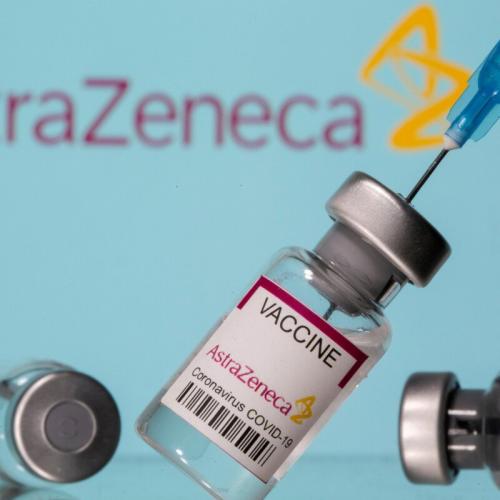
Note: The new richest man in Asia reached his position partially through making vaccines for the coronavirus. For more along these lines, see concise summaries of deeply revealing news articles on income inequality from reliable major media sources.
David Beasley, the executive director of the World Food Programme, knows the existence of his organization is both a blessing and a curse: it helps so many, but that means many are suffering. On Friday, that World Food Programme's fight against hunger ... was honored with the Nobel Peace Prize. "[COVID-19] comes on top of what you already thought was a worst-case scenario. It is literally horrific," Beasley told ABC News. At the beginning of this year, 135 million people already faced starvation from manmade conflict and climate extremes, Beasley said. Now, 270 million people are on the brink of starvation. "We've got a vaccine against starvation. It's called food," said Beasley. The award comes with the equivalent of a $1.1 million U.S. cash prize and a gold medal to be handed out at a ceremony in Oslo, Norway, on Dec. 10. "The economies of the world's strongest nations on Earth are struggling. We are not going to have the money we need next year. And not only are the resources going to go down, but the needs are going to be going up," said Beasley. Established in 1962, the United Nations World Food Programme is the world's largest humanitarian organization that delivers food assistance in emergencies and works with communities to improve nutrition and resilience, according to the website. The World Food Programme assisted 97 million people in 88 counties in 2019 alone.
Note: As of early October 2020, 1.5 million people had reportedly died from the virus, yet 135 million had been pushed to "the brink of starvation" not by the virus, but by the lockdown measures. Are the consequences of the lockdown policies worse than the consequences of the virus itself? For more along these lines, see concise summaries of deeply revealing news articles on the coronavirus from reliable major media sources.
An inspiring discussion about racism between a white woman and black man ... has captured the attention of [millions]. Caroline Brock and Ernest Skelton share a special relationship. It all started with Skelton coming over to fix one of her appliances. People judge me before I even come in the door, so thats the reason why I ask, Is it OK for me to come in? said Skelton. The question caught Brock completely off guard. Over the weekend, Skelton went back over to Brocks home for second appliance repair appointment. Thats when Brock asked him a question that was a little more personal. How are you doing right now given the current climate? Brock wanted to know what the day-to-day life of a black man is like. Skelton opened up and told her some stories about how racism has affected him. He gets pulled over in his work vehicle at least half a dozen times a year. I dont even remember the last time I was pulled over, Brock said. Sometimes I have customers that need me after 5 oclock and I have to reschedule for another day. Im afraid that Ill wind up getting pulled over, and this time, I wont make it home," Skelton said. Brock asked Ernest if she could post their interaction on Facebook. He thought it would be a great idea. A few days later, they had more than 100,000 shares. In the comments ... a lot of white people say, Id love to have these conversations, but Im scared ... Im going to offend someone," Brock explained. But Skelton said he wasnt offended. If we want to change the world and make our country stronger, we have to be willing to step into the uncomfortableness," Brock said. The two hope that their interaction can inspire others to open up the conversation.
Note: Don't miss this highly inspiring and educational facebook post. This is how we change the world for the better. Explore a treasure trove of concise summaries of incredibly inspiring news articles which will inspire you to make a difference.
Important Note: Explore our full index to revealing excerpts of key major media news articles on several dozen engaging topics. And don't miss amazing excerpts from 20 of the most revealing news articles ever published.