


Income Inequality News Stories
Below are key excerpts of revealing news articles on income inequality from reliable news media sources. If any link fails to function, a paywall blocks full access, or the article is no longer available, try these digital tools.

Today, the United States has less equality of opportunity than almost any other advanced industrial country. Study after study has exposed the myth that America is a land of opportunity. This is especially tragic: While Americans may differ on the desirability of equality of outcomes, there is near-universal consensus that inequality of opportunity is indefensible. The Pew Research Center has found that some 90 percent of Americans believe that the government should do everything it can to ensure equality of opportunity. The upwardly mobile American is becoming a statistical oddity. Economic mobility in the United States is lower than in most of Europe and lower than in all of Scandinavia. The life prospects of an American are more dependent on the income and education of his parents than in almost any other advanced country for which there is data. Latinos and African-Americans still get paid less than whites, and women still get paid less than men, even though they recently surpassed men in the number of advanced degrees they obtain. Discrimination, however, is only a small part of the picture. Probably the most important reason for lack of equality of opportunity is education: both its quantity and quality. After 1980, the poor grew poorer, the middle stagnated, and the top did better and better. A result was a widening gap in educational performance the achievement gap between rich and poor kids born in 2001 was 30 to 40 percent larger than it was for those born 25 years earlier, the Stanford sociologist Sean F. Reardon found.
Note: The author of this article, Joseph E. Stiglitz, a Nobel laureate in economics, a professor at Columbia and a former chairman of the Council of Economic Advisers and chief economist for the World Bank, is the author of The Price of Inequality. For deeply revealing reports from reliable major media sources on income inequality, click here.
Syracuse University art professor Thomas Gokey earned his Master of Fine Arts degree five years ago, but remains chained to his alma mater by $49,983 of debt. Soon after he graduated, the grim prospect of indefinite payments inspired its own art piece. Gokey put his debt up for sale in reconstituted squares of shredded money from the Federal Reserve. This year, together with the activist group Strike Debt, he helped organize a bold "People's Bailout" called the Rolling Jubilee, which has raised over $465,000. Bringing that money to the marketplace where collections companies buy and sell debt for pennies on the dollar, Strike Debt intends to purchase about $9 million of Americans' medical and educational debtand then cancel it. Strike Debt, which grew out of Occupy Wall Street, wants to foment conversation about the debt we rack up in pursuit of basic needs, and the industries that profit from that debt. Gokey is currently on a year-long unpaid leave from teaching to help organize the Rolling Jubilee and upcoming Strike Debt projects. Thomas Gokey: Since I'm an educator, I'm thinking about the ways in which my students and I seem to be getting taken advantage of. We look at how much it's costing each one of my students to take one of my classes, and how much I'm getting paid to teach the class. And we look at each other and think, why don't we just go hold our classes at the public library? Somebody's obviously making money off both of us, so can't we cut out that middleman and focus on education?
Note: For deeply revealing reports from reliable major media sources on income inequality, click here.
Incomes rose more than 11 percent for the top 1 percent of earners during the economic recovery, but not at all for everybody else. The numbers, produced by Emmanuel Saez, an economist at the University of California, Berkeley, show overall income growing by just 1.7 percent over the period. But there was a wide gap between the top 1 percent, whose earnings rose by 11.2 percent, and the other 99 percent, whose earnings declined by 0.4 percent. Mr. Saez, a winner of the John Bates Clark Medal, an economic laurel considered second only to the Nobel, concluded that the Great Recession has only depressed top income shares temporarily and will not undo any of the dramatic increase in top income shares that has taken place since the 1970s. Excluding earnings from investment gains, the top 10 percent of earners took 46.5 percent of all income in 2011, the highest proportion since 1917, Mr. Saez said, citing a large body of work on earnings distribution over the last century that he has produced with the economist Thomas Piketty of the Paris School of Economics.
Note: For deeply revealing reports from reliable major media sources on income inequality, click here.
Some rich countries are more unequal than others - and the United States more so than most. America has a higher degree of income inequality than almost any other developed country. Only three of the 34 members of the Organization for Economic Cooperation and Development rank higher - Chile, Mexico and Turkey. So why is the U.S. so much more unequal than its peers? The U.S. Congressional Research Service cited several potential reasons in a report earlier this year. One is that most other rich countries spend a bigger share of their national output on social programs, which tend to lessen income inequality. In Germany, public social spending accounted for 27.8 percent of gross domestic product in 2009, compared with 19.2 percent in the United States. A second factor is tax systems. A 2012 study by economists at the OECD found that, in general, the more a country spends on social programs, and the more progressive its tax-and-transfer system is, the more it can reduce income inequality. The U.S. is less effective at reducing inequality through taxes and benefits than the OECD average. Attitudes toward the poor may make a difference, some researchers say. A 2008 OECD study found that respondents in the United States and Korea were far more likely to say poor people were poor because they are lazy than did respondents in Nordic and Continental European countries. Recent studies ... have shown that Americans are now less likely to move into a class above their parents than are people in other rich countries.
Note: For deeply revealing reports from reliable major media sources on income inequality, click here.
Journalist Chrystia Freeland has spent years reporting on the people who've reached the pinnacle of the business world. For her new book, Plutocrats: The Rise of the New Global Super-Rich and the Fall of Everyone Else, she traveled the world, interviewing the multimillionaires and billionaires who make up the world's elite super-rich. Those at the very top, Freeland says, have told her that American workers are the most overpaid in the world, and that they need to be more productive if they want to have better lives. "It is a sense of, you know, 'I deserve this,' " she says. "I do think that there is both a very powerful sense of entitlement and a kind of bubble of wealth which makes it hard for the people at the very top to understand the travails of the middle class." How are the super-rich ... different from the super-rich of the past say, 1955? Well, there are many more of them, and they're a lot richer than they used to be. "One of the things which is really astonishing is how much bigger the gap is than it was before," she says. "In the 1950s, America was relatively egalitarian, much more so than compared to now." CEOs earn exponentially more now, compared with their workers, than they did 60 years ago. Freeland says she's worried about what she calls an inevitable human temptation that people who've benefited from a mobile society, like America, will get to the top and then rig the rules to benefit themselves." You don't do this in a kind of chortling, smoking your cigar, conspiratorial thinking way," she says. "You do it by persuading yourself that what is in your own personal self-interest is in the interests of everybody else.
Note: For a fascinating excerpt from this book, click here. For revealing major media articles showing the stark gap between the uber-rich and the rest of us, click here.
Branko Milanovic is an economist at the World Bank. He first became interested in income inequality studying for his PhD in the 1980s in his native Yugoslavia, where he discovered it was officially viewed as a "sensitive" subject which meant one the ruling regime didn't want its scholars to look at too closely. But when Milanovic moved to Washington, he discovered a curious thing. Americans were happy to celebrate their super-rich and, at least sometimes, worry about their poor. But putting those two conversations together and talking about economic inequality was pretty much taboo. "I was once told by the head of a prestigious think tank in Washington, D.C., that the think tank's board was very unlikely to fund any work that had income or wealth inequality in its title," Milanovic ... explained in a recent book. "Yes, they would finance anything to do with poverty alleviation, but inequality was an altogether different matter." "Why?" he asked. "Because 'my' concern with the poverty of some people actually projects me in a very nice, warm glow: I am ready to use my money to help them. Charity is a good thing; a lot of egos are boosted by it and many ethical points earned even when only tiny amounts are given to the poor. But inequality is different: Every mention of it raises in fact the issue of the appropriateness or legitimacy of my income." When the discussion shifts from celebratory to analytical, the super-elite get nervous.
Note: Excerpted from Plutocrats: The Rise of the New Global Super-Rich and the Fall of Everyone Else by Chrystia Freeland. For revealing major media articles showing the stark gap between the uber-rich and the rest of us, click here.
The U.S. has gone through two recoveries. The 1.2 million households whose incomes put them in the top 1 percent of the U.S. saw their earnings increase 5.5 percent last year, according to estimates released last month by the U.S. Census Bureau. Earnings fell 1.7 percent for the 96 million households in the bottom 80 percent -- those that made less than $101,583. The recovery that officially began in mid-2009 hasnt arrived in most Americans paychecks. In 2010, the top 1 percent of U.S. families captured as much as 93 percent of the nations income growth, according to a March paper by Emmanuel Saez, a University of California at Berkeley economist who studied Internal Revenue Service data. The earnings gap between rich and poor Americans was the widest in more than four decades in 2011, Census data show, surpassing income inequality previously reported in Uganda and Kazakhstan. The notion that each generation does better than the last -- one aspect of the American Dream -- has been challenged by evidence that average family incomes fell last decade for the first time since World War II. In this recovery its proved better to own stock than a house. For stockholders ... the value of all outstanding shares has soared $6 trillion to $17 trillion since June 2009, the recessions end. Even after a recent rebound, the value of owner-occupied housing, the chief asset of most middle- income families, has dropped $41 billion in the same period, part of a $5.8 trillion loss in home values since 2006.
Note: For deeply revealing reports from reliable major media sources on income inequality, click here.
In the early 14th century, Venice was one of the richest cities in Europe. By 1500, Venices population was smaller than it had been in 1330. In the 17th and 18th centuries, as the rest of Europe grew, the city continued to shrink. The story of Venices rise and fall is told by the scholars Daron Acemoglu and James A. Robinson, in their book Why Nations Fail: The Origins of Power, Prosperity, and Poverty, as an illustration of their thesis that what separates successful states from failed ones is whether their governing institutions are inclusive or extractive. Extractive states are controlled by ruling elites whose objective is to extract as much wealth as they can from the rest of society. Inclusive states give everyone access to economic opportunity; often, greater inclusiveness creates more prosperity, which creates an incentive for ever greater inclusiveness. The history of the United States can be read as one such virtuous circle. But as the story of Venice shows, virtuous circles can be broken. Elites that have prospered from inclusive systems can be tempted to pull up the ladder they climbed to the top. Eventually, their societies become extractive and their economies languish. That ... is the danger America faces today, as the 1 percent pulls away from everyone else and pursues an economic, political and social agenda that will increase that gap even further ultimately destroying the open system that made America rich and allowed its 1 percent to thrive in the first place.
Note: The author of this article, Chrystia Freeland, wrote the book Plutocrats: The Rise of the New Global Super-Rich and the Fall of Everyone Else, from which this essay is adapted. For deeply revealing reports from reliable major media sources on income inequality, click here.
The rich got quite a bit richer this past year, according to this year's rankings of the 400 wealthiest Americans. Forbes magazine released its annual list on [September 19], and the combined net worth jumped 13% to $1.7 trillion in 2012, up from $1.5 trillion in 2011. The boost came thanks to the rising stock market and a rebound in real estate values - especially in cities like Los Angeles and New York. Microsoft founder Bill Gates remained at the top of the list, as his net worth rose $7 billion to $66 billion. His pal Warren Buffett, CEO of Berkshire Hathaway, also saw his net worth climb by $7 billion, which helped him retain the number two spot on the list with $46 billion. Another software mogul, Oracle CEO Larry Ellison, enjoyed the biggest increase in wealth of anyone on the list -- a jump of $8 billion. That put his net worth at $41 billion, ranking him No. 3 on the list. The average net worth of a member of the Forbes 400 hit $4.2 billion. That's the highest level it's been in at least a decade, according to the magazine, and up from $3.8 billion last year. The net worth cut off to make the list this year was $1.1 billion. Forbes said that 241 members of the 400 enjoyed an increase in their net worth, while only 66 members suffered a decline.
Note: For deeply revealing reports from reliable major media sources on income inequality, click here.
The world's super-rich have taken advantage of lax tax rules to siphon off at least $21 trillion, and possibly as much as $32tn, from their home countries and hide it abroad a sum larger than the entire American economy. James Henry, a former chief economist at consultancy McKinsey and an expert on tax havens, has conducted groundbreaking new research for the Tax Justice Network campaign group sifting through data from the Bank for International Settlements (BIS), the International Monetary Fund (IMF) and private sector analysts to construct an alarming picture that shows capital flooding out of countries across the world and disappearing into the cracks in the financial system. "This offshore economy is large enough to have a major impact on estimates of inequality of wealth and income; on estimates of national income and debt ratios; and most importantly to have very significant negative impacts on the domestic tax bases of 'source' countries," Henry says. John Christensen of the Tax Justice Network [commented] "Inequality is much, much worse than official statistics show, but politicians are still relying on trickle-down to transfer wealth to poorer people. This new data shows the exact opposite has happened: for three decades extraordinary wealth has been cascading into the offshore accounts of a tiny number of super-rich." In total, 10 million individuals around the world hold assets offshore, according to Henry's analysis; but almost half of the minimum estimate of $21tn $9.8tn is owned by just 92,000 people.
Note: Henry's report, entitled The Price of Offshore Revisited, is available here. For more on this, click here.
Emmanuel Saez is ... director of Berkeleys Center for Equitable Growth. In 2008, on the cusp of the Great Recession, Saez co-authored a landmark study that revealed a stark gap between the earnings of Americas wealthiest households and the remaining 99 percent. Saezs recent work shows that, while the recession initially reduced the income gap, postrecession gains have mostly gone to the top 1 percent. The extraordinary increase in income concentration in the United States from 2002 to 2007 was driven in large part by deregulation of the financial and real estate industries. The resulting real estate bubble triggered the 2008 recession. Evidence shows that progressive taxation is the most powerful tool for curbing income concentration. For example, from the Great Depression into the 1970s, when the U.S. had very high tax rates on top earners, the income gap was very small, and economic growth was incredibly strong. During the 1990s, incomes for the top 1% nearly doubled, while paychecks for the bottom 99% went up only 20%. Between 2002 and 2007 2/3 of all income gains went to the top 1%. In 2010, the first year of economic recovery, the top 1% captured 93% of income gains.
Note: For Prof. Saez's excellent study, "The Evolution of Top Incomes in the United States" click here.
Capitalism's recurring tendencies toward extreme and deepening inequalities of income, wealth, and political and cultural power require resignation and acceptance. [It] entails and reproduces a highly undemocratic organization of production inside enterprises. Believers insist that no alternatives to ... capitalist organizations of production exist or could work nearly so well. Of course, alternatives exist. The city of Arrasate-Mondragon, in the Basque region of Spain ... is the headquarters of the Mondragon Corporation (MC). MC is composed of many co-operative enterprises grouped into four areas: industry, finance, retail and knowledge. In each enterprise, the co-op members (averaging 80-85% of all workers per enterprise) collectively own and direct the enterprise. The largest corporation in the Basque region, MC is also one of Spain's top ten biggest corporations (in terms of sales or employment). And MC has expanded internationally, now operating over 77 businesses outside Spain. MC has proven itself able to grow and prosper as an alternative to and competitor of capitalist organizations of enterprise. MC worker-members collectively choose, hire and fire the directors, whereas in capitalist enterprises the reverse occurs. One of the co-operatively and democratically adopted rules governing the MC limits top-paid worker/members to earning 6.5 times the lowest-paid workers. In US corporations, CEOs can expect to be paid 400 times an average worker's salary a rate that has increased 20-fold since 1965.
The average American family's net worth dropped almost 40% between 2007 and 2010, according to a triennial study released [on June 11] by the Federal Reserve. The stunning drop in median net worth -- from $126,400 in 2007 to $77,300 in 2010 -- indicates that the recession wiped away 18 years of savings and investment by families. The results ... highlight the marked deterioration in household finances brought on by the financial crisis and ensuing recession. Much of the drop off in net worth -- to levels not seen since 1992 -- was attributable to a sharp decline in housing values, the Fed said. In 2007, the median homeowner had a net worth of $246,000. Three years later that number had fallen to $174,500, a loss of more than $70,000 on average. Making matters worse, income levels also fell during the tumultuous three-year period, with median pre-tax income falling 7.7% as earnings from capital gains all but disappeared. The loss of income and net worth appears to have impacted savings rates, as the number of Americans who said they saved in the prior year fell from 56.4% in 2007 to 52.0% in 2010 -- the lowest level recorded since the early 1990s. Families in the top 10% of income actually saw their net worth increase over the period, rising from a median of $1.17 million in 2007 to $1.19 million in 2010. Middle-class families who ranked in the 40th to 60th percentile of income earners reported that their median net worth fell from $92,300 to $65,900 over the same time period.
Note: What this article fails to emphasize sufficiently is that while most people have lost vast amounts of wealth, the wealthiest 1% has grown incredibly richer even through the recession. Is something wrong here? For key reports from reliable sources on wealth inequality, click here.
A World Bank report shows a broad-based reduction in extreme poverty - and indicates that the global recession, contrary to economists' expectations, did not increase poverty in the developing world. The report shows that for the first time the proportion of people living in extreme poverty - on less than $1.25 a day - fell in every developing region between 2005 and 2008. And the biggest recession since the Great Depression seems not to have thrown that trend off course, preliminary data from 2010 indicate. The progress is so dramatic that the world has met the United Nations' Millennium Development Goals to cut extreme poverty in half five years before its 2015 deadline. That is contrary to the World Bank's own expectations. In a year-end 2008 report, the Washington-based development institution warned: "Unemployment is on the rise in industrial countries and poverty is set to increase across low- and middle income countries, bringing with it a substantial deterioration in conditions for the world's most vulnerable." But that did not happen. Surveys for 2010 show that the proportion of people in the developing world living in extreme poverty fell. That is because of strong growth in countries like Brazil, India and especially China, growth that helped buoy economies in Africa and South America.
The wealthy really are different from everyone else: Theyre more likely to cheat, lie, and break the law. At least thats the unflattering conclusion of a team of professors from the University of Torontos Rotman School of Management and the University of California, Berkeley, who ran a battery of tests involving more than 1,000 people, seeking to answer the question of whether being rich or poor influenced ethical behaviour. In results from seven separate studies, they found a consistent tendency among those they termed upper-class to be more likely to break the law while driving, take valued goods from others, lie in negotiations, cheat to increase their chances of winning a prize and endorse unethical behaviour at work. The reason for the ethical difference was simple. Wealthier people are more likely to have an attitude that greed is good. At first glance, it might seem more likely that poorer people would be more tempted to cheat or break the law, in order to improve their lot in life. But a growing body of research is coming to the opposite conclusion that its people at the top of the income scale for whom honesty, integrity, and generosity seem to be a challenge. In the United States, for instance, despite the perception that the rich are great philanthropists, data show that upper-class households donate a smaller proportion of their incomes to charity than do lower-class families. Other research has found that those who are well off have a reduced concern for others.
88 million. That's how many working-age Americans don't have a job and aren't trying to find one. The increase in people dropping out of the labor market altogether skews the otherwise-positive unemployment numbers released last week. While the jobless rate fell to 8.3 percent in January - a three-year low - it doesn't [take into account] this army of nonworking Americans. The percentage of people participating in the labor market dropped to 63.7 percent last month, the lowest level since May 1983.
Note: This one small article reveals an astounding statistic the media and government are all but ignoring. The actual rate of jobless Americans is well over 30%. The U.S. government definition of unemployed covers only those who "do not have a job, have actively looked for work in the prior 4 weeks, and are currently available for work."
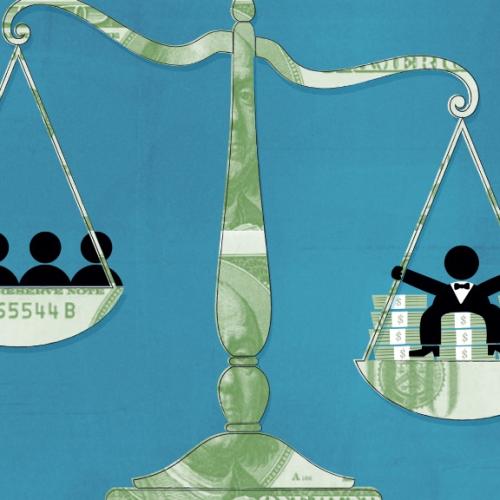
Inequality in America. It's a subject that's getting more attention in light of the weak economy and the ongoing debate around budget cuts and raising revenues. Billionaire businessman ... Warren Buffett, who has argued in favor of higher taxes on the wealthiest, [discusses] the growing disparity. WARREN BUFFETT: It should be a land of opportunity. But the ... market system has led to extremes. Everybody in this country owes their good fortune in some way to the rest of the country. DAN ARIELY: People don't understand how much wealth the top 20 percent have. They actually have 84 percent of the wealth. And more disturbingly, people don't understand how little wealth the bottom of the distribution have. The bottom 40 percent of the U.S. have about 0.3 percent of the wealth, basically zero. RICHARD FREEMAN: In the last 30 years or so, the share of national [income] -- of income that has gone to the upper 0.1 percent -- not to the upper 1.0 percent -- 0.1 percent -- rose by 10 percentage points. That is one of the most astounding patterns I have ever seen in data. People sometimes say, oh, the rich, it's the upper 10 percent, it's the upper 5 percent. No, no, this is the 0.1 percent. Warren Buffett has this wonderful statement where he says: Yes, there's been a class war in the United States. And my class, namely the super rich people, have won.
Note: For key articles from major media sources on the extreme income inequality in the US, click here.
[The US is now] a country whose patrician overlords are regularly conjuring the feudalism of Europe circa the Middle Ages. Today, our mayors deploy police against homeless people and protesters; our governors demand crushing budget cuts from the confines of their taxpayer-funded mansions; our Congress exempts itself from insider-trading laws and requires the government to offer lawmakers the good health benefits so many Americans have no access to ; and our nation's capital has become one of the world's wealthiest cities, despite the recession. Taken together, we see that there really are "Two Americas," as the saying goes - and that's no accident. It's the result of a permanent elite that is removing itself from the rest of the nation. Nowhere is this more obvious than in education - a realm in which this elite physically separates itself from us mere serfs. The Washington Post, for instance, notes that it has become an unquestioned "tradition among Washington's power elite" - read: elected officials - to send their kids to the ultra-expensive private school Sidwell Friends. At the same time, many of these officials have backed budget policies that weaken public education. In many cases, these aristocrats aren't even required to publicly explain themselves. Worse, on the rare occasions that questions are posed, privacy is the oft-used excuse to not answer. This might be a convincing argument about ordinary citizens' personal education choices, but it's an insult coming from public officials.
Note: For a treasure trove of reliable reports on social inequality in the US, click here and here.
Americans have never much liked government. After all, the nation was conceived in a revolution against government. But the surge of cynicism engulfing America isn't about how big government has become. It's a growing perception that our government is no longer working for average people. It's for big business, Wall Street and the very rich. The richest Americans are taking home a bigger share of total income than at any other time since the 1920s. Their tax payments are down because the Bush tax cuts reduced their top rates to the lowest level in more than half a century, and cut capital gains taxes to 15 percent. Congress hasn't even closed a loophole that allows mutual-fund and private-equity managers to treat their incomes as capital gains. So the 400 richest Americans, whose total wealth exceeds the combined wealth of the bottom 150 million Americans put together, pay an average of 17 percent of their income in taxes. That's lower than the tax rates of most day laborers. And the share of revenues coming from corporations has been dropping. The biggest, like GE, find ways to pay no federal taxes at all. Many shelter their income abroad, and every few years Congress grants them a tax amnesty to bring the money home. Get it? "Big government" isn't the problem. The problem is the big money that's taking over government. Government is doing less of the things most of us want it to do ... and more of the things big corporations, Wall Street and the wealthy want it to do.
Note: The author of this analysis, Robert Reich, is a former U.S. secretary of labor, is professor of public policy at UC Berkeley and the author of Aftershock: The Next Economy and America's Future. He blogs at www.robertreich.org.
Chief executive pay has roared back after two years of stagnation and decline. America's top bosses enjoyed pay hikes of between 27 and 40% last year, according to the largest survey of US CEO pay. The dramatic bounceback comes as the latest government figures show wages for the majority of Americans are failing to keep up with inflation. America's highest paid executive took home more than $145.2m, and as stock prices recovered across the board, the median value of bosses' profits on stock options rose 70% in 2010, from $950,400 to $1.3m. The news comes against the backdrop of an Occupy Wall Street movement that has focused Washington's attention on the pay packages of America's highest paid. The survey, the most extensive in the US, covered 2,647 companies, and offers a comprehensive assessment of all the data now available relating to 2010 pay. This year's survey shows CEO pay packages have boomed: the top 10 earners took home more than $770m between them in 2010. As stock prices began to recover last year, the increase in CEO pay outstripped the rise in share value. The Russell 3000 measure of US stock prices was up by 16.93% in 2010, but CEO pay went up by 27.19% overall. For S&P 500 CEOs, the largest companies in the sample, total realised compensation including perks and pensions and stock awards increased by a median of 36.47%. Total pay at midcap companies, which are slightly smaller than the top firms, rose 40.2%.
Note: For key reports on income inequality from reliable sources, click here.
Important Note: Explore our full index to revealing excerpts of key major media news stories on several dozen engaging topics. And don't miss amazing excerpts from 20 of the most revealing news articles ever published.